Always watching. Instantly actionable.
Three integrated layers: continuous sensing, AI source attribution, and automated dispatch. From first molecule to closed work order.
Continuous emissions sensing
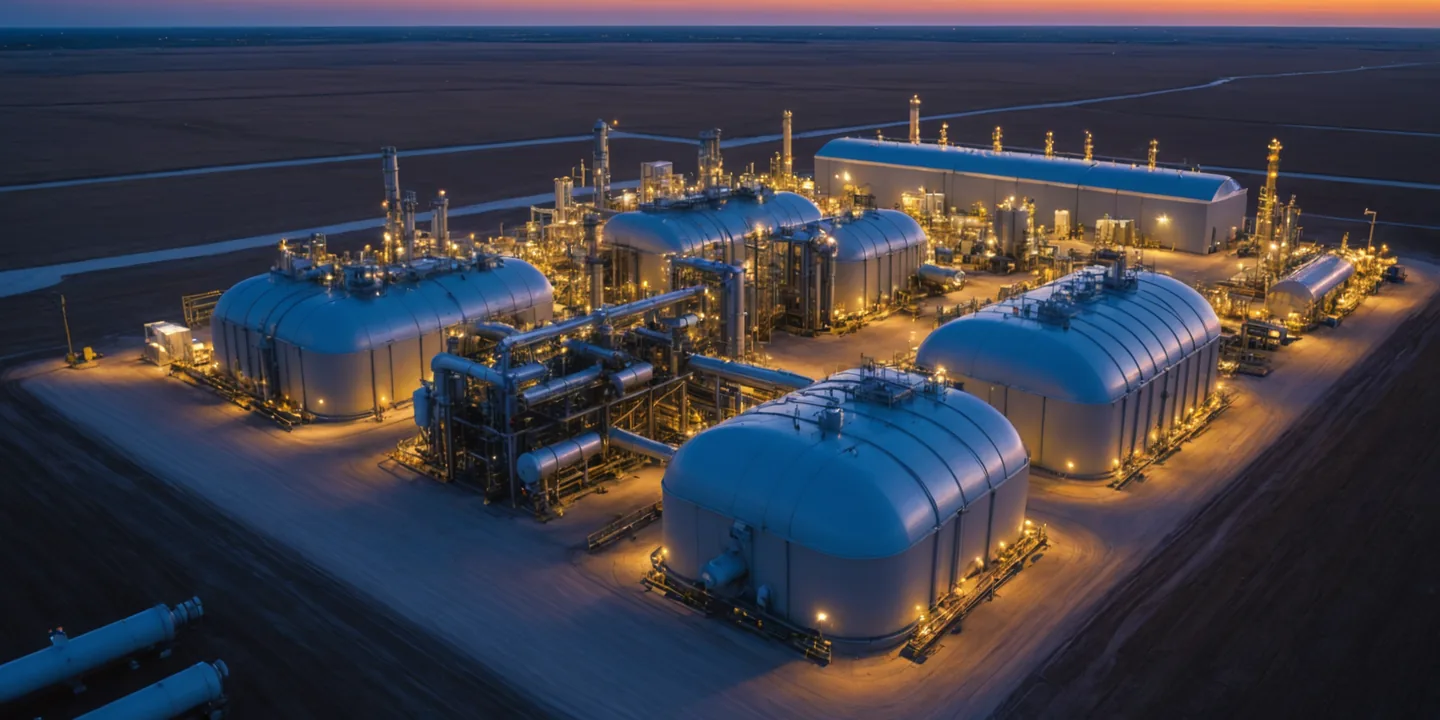
Distributed sensor arrays monitor your site perimeter and equipment zones without gaps. Unlike quarterly OGI walk-downs that leave a 60-to-90-day detection window, Aquanta Vision sensors report every 90 seconds. A compressor seal failure that starts Monday morning is flagged Monday morning.
- Methane, VOC, and CO2 measurement in one sensor node
- Edge processing on-site with cloud data aggregation
- OOOOb-compliant data retention and timestamped records
- Battery and solar-assist models for remote pads
Pin the leak to the exact component
When concentration spikes, the platform solves the inverse dispersion problem: given wind direction, sensor readings from each node, and the facility equipment map, which specific fitting is the source? Crews arrive at the right valve on the first visit.
- Component-level resolution from array triangulation
- Atmospheric dispersion model updated with live met data
- Confidence-rated attribution output with sensor trace
Separator
Control Valve
Compressor
Header
Pressure Relief97% match
Scrubber
Flow Meter
Block Valve
From detection to dispatch in under 10 minutes
Five automated steps replace the phone tag and spreadsheet chase that slows most LDAR programs.
01
Detection
Sensor array flags concentration spike
02
Source Pin
AI identifies component within 4-8 minutes
03
Alert
Operations notified with source details
05
Dispatch
Closest available crew routed to pad
04
Work Order
Auto-generated with component ID and priority
The operations center your team actually uses
Active Alerts
Pad C-07 / PRV-02 (Pressure Relief)
Attribution confidence: 97% CH4: 312 ppm Duration: 4 h 12 min
Pad A-12 / FV-11 (Control Valve)
Attribution confidence: 84% CH4: 87 ppm Duration: 47 min
Emissions Rate - Pad C-07 (48 hr)
Alert threshold exceeded at T-04:12 UTC
| Site | Sensors | Status | Last Event | Open WOs |
|---|---|---|---|---|
| Pad C-07 | 12 / 12 | Alert | 4 h 12 min ago | 2 |
| Pad A-12 | 8 / 8 | Alert | 47 min ago | 1 |
| Station MG-3 | 16 / 16 | Normal | 12 days ago | 0 |
| Pad B-04 | 10 / 10 | Normal | 31 days ago | 0 |
Fits your existing operations stack
No ripping out SCADA or rebuilding workflows. Aquanta Vision connects to what you already run.
SCADA / DCS
OPC-UA and Modbus TCP connectors sync sensor readings into your existing control room displays in real time.
CSV / Flat File Export
Timestamped data exports on a configurable schedule for regulatory submission and internal EHS reporting.
REST API
Authenticated JSON endpoints for site events, attributions, work orders, and historical emissions readings.
Email and SMS Alerts
Configurable notification rules by site, event severity, and crew assignment. No app required for field teams.
"The source attribution alone paid for the first year. Our crew used to spend half a day finding which valve was leaking. Now they arrive knowing exactly which component needs work. First-visit fix rate went from 60 percent to over 90."
See the platform on your site data
Schedule a 30-minute demo and we will map Aquanta Vision against your actual facility layout and compliance requirements.
No commitment required.