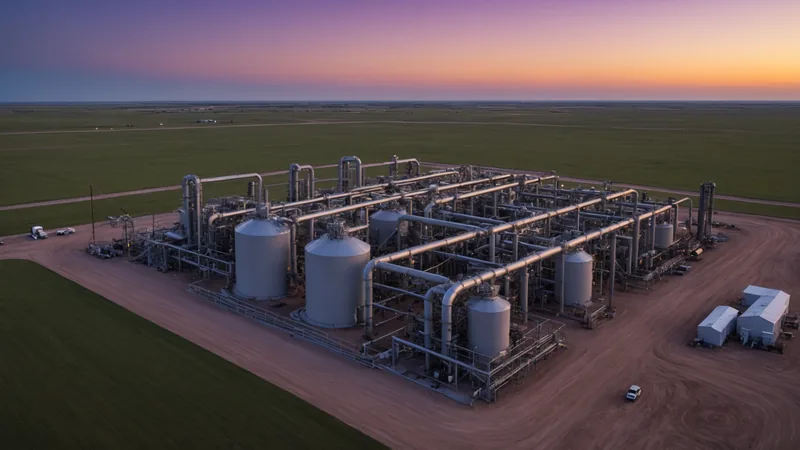
We spent the first six months of our early-access deployments at gathering and compression sites learning things that sensor specifications and atmospheric modeling papers do not tell you. Some of what we found aligned with what we expected. Most of it was more nuanced, and three patterns in particular changed how we think about sensor placement, alert workflows, and what continuous monitoring is and is not good at in a midstream operating environment.
Pattern One: Equipment Layout Mattered More Than Sensor Sensitivity
Before we deployed, the technical specification that occupied most of our preparation time was detection sensitivity: what concentration could each sensor reliably measure, and what minimum emission rate would produce a detectable concentration at a given standoff distance. These are important numbers, and our sensors perform well on them. But in practice, the sensor sensitivity spec was rarely the limiting factor for detection at the sites we were monitoring.
The limiting factor was almost always where the sensor was placed relative to the prevailing wind direction and the specific equipment area of interest. At one gathering compressor site, we had initially positioned sensors at the perimeter of the pad based on standard coverage logic, one sensor per face of the roughly rectangular equipment footprint. This worked well for equipment on the windward and crosswind faces. For equipment on the leeward face, the sensors were downstream of everything else on the pad, and the signal from a specific leeward component was diluted and mixed with the ambient signal from the rest of the equipment by the time it reached our sensors. We were detecting that something was happening somewhere on the pad, but the source attribution for leeward-side events was substantially worse than for the other sides.
The resolution was to add intermediate sensors within the equipment array rather than relying entirely on perimeter coverage, specifically positioned to improve resolution on the leeward equipment strings. This changed the deployment cost model: more sensors per site than our initial estimate, with the additional sensors driven by site-specific airflow patterns rather than nominal coverage area. The lesson is that atmospheric modeling done at a desk does not fully substitute for site characterization done with an anemometer and a physical walk of the equipment layout.
Pattern Two: Alert Calibration Took Longer Than Expected
The first two weeks at each new site produced more alerts than the following two months. Not because there were more actual emission events in the first two weeks, but because the alert thresholds needed calibration against the site's specific baseline concentration and variability patterns, and that calibration required time and real data from the site's operating conditions.
Methane background concentration is not constant. It varies with time of day, season, regional emissions from adjacent sources, and site-specific factors like nearby cattle operations, marshy terrain, and the gas composition of the gas being processed. A threshold that works well in stable weather with steady background concentrations will generate false alerts on a day when a weather front pushes higher-background-concentration air masses across the region. An alert threshold set tightly enough to catch small events will fire on benign background variation more than the field crew wants to see.
We found that each new site required a minimum of two to three weeks of monitoring data to characterize its baseline distribution accurately enough to set alert thresholds that balanced sensitivity against false positive rate. During this calibration period, alerts were flagged for operator review rather than triggering work orders, because the false positive rate was too high for actionable dispatch. Operators who expected to be receiving actionable work orders from day one of deployment were surprised by this lead time, and we have since built the calibration period into our deployment process explicitly rather than treating it as a setup step that could be compressed.
Pattern Three: The Work Order Integration Was the Operational Bottleneck
We have described the sensor-to-work-order workflow challenge in more detail in a separate post, but the field lesson from early deployments deserves its own summary. Detection worked well once we got calibration right. Attribution worked well enough to give field crews meaningful starting points. The operational value capture was consistently held back by the work order and dispatch workflow on the operator's side.
At one site, we were generating well-attributed alerts within minutes of event onset, but those alerts were going to an email inbox that was reviewed once daily by one EHS coordinator. The actual dispatch from that alert to a field crew inspection took an average of two to three days from alert generation. The two-to-three-minute continuous monitoring advantage over quarterly OGI was being eroded to two-to-three-day response latency by a human process bottleneck, not by any technical limitation.
The fix was not technical. It was a procedural change: establishing a real-time monitoring notification channel that went to the operations supervisor on duty rather than to the EHS coordinator's email queue, with a defined response time expectation for alerts above a certain threshold. That procedural change, with no hardware or software modification, reduced average response time from days to hours. The lesson is that continuous monitoring is a detection capability, not a dispatch capability. The dispatch side needs its own process design.
What We Did Not Expect: Verification Was a Win
The pattern we did not anticipate, and that operators at every early-access site have commented on positively, was the value of automated repair verification. In quarterly OGI programs, verifying that a repair held requires scheduling a follow-up survey visit. This takes time, and in practice many operators skip formal verification for smaller events and rely on the next quarterly survey to confirm resolution. Under OOOOb's verified repair requirements, this approach creates a compliance documentation gap.
With continuous monitoring running, repair verification is not a scheduled event. It is an observation: after the repair crew finishes the work and leaves the site, the monitoring system either confirms that the concentration has returned to baseline at the adjacent sensors, or it does not. If the repair was successful, the signal clears within a few hours of completion. If the repair did not fully seal the fitting, the elevated signal persists and generates a re-alert automatically. We have caught several partial repairs this way that would not have been identified until the next quarterly survey under the previous program, and in each case the early re-catch prevented another full cycle of emission time before repair.
Where We Are Now
Six months of early-access data gave us a clearer picture of what continuous monitoring is and is not. It is very good at catching events that start between survey dates. It is good at narrowing the field crew's search to a specific equipment area. It is good at verifying repair automatically. It is not a complete replacement for physical inspection, it is not perfectly accurate on source attribution under all conditions, and the alert-to-dispatch workflow is often the practical bottleneck, not the technology itself.
The sites where we have seen the most consistent value are mid-size compressor stations and gathering terminals with relatively stable wind conditions, existing LDAR programs that need documentation support for OOOOb compliance, and operators who treated the deployment as a workflow redesign project rather than just a sensor installation. The sites where the results were more modest were smaller wellpads with infrequent events, where the monitoring cost was harder to justify on the available event rate, and sites with complex terrain that made calibration and attribution more demanding.
The deployment experiences described in this article are drawn from our early-access pilot program at a small number of sites. Site-specific configurations, atmospheric conditions, equipment ages, and operational parameters vary, and outcomes at other sites may differ from those described here. This is a qualitative account of field learning, not a performance guarantee. Continuous monitoring is an estimate-based system; source attributions are starting points for inspection, not definitive identifications.